Wastewater Treatment Division
KPIs or key performance indicators, are quantifiable measures of performance over time for a specific objective to pursue continuous improvement. Our specific KPIs provide targets for our teams to shoot for, milestones to gauge progress, and insights that help us make better operational decisions.
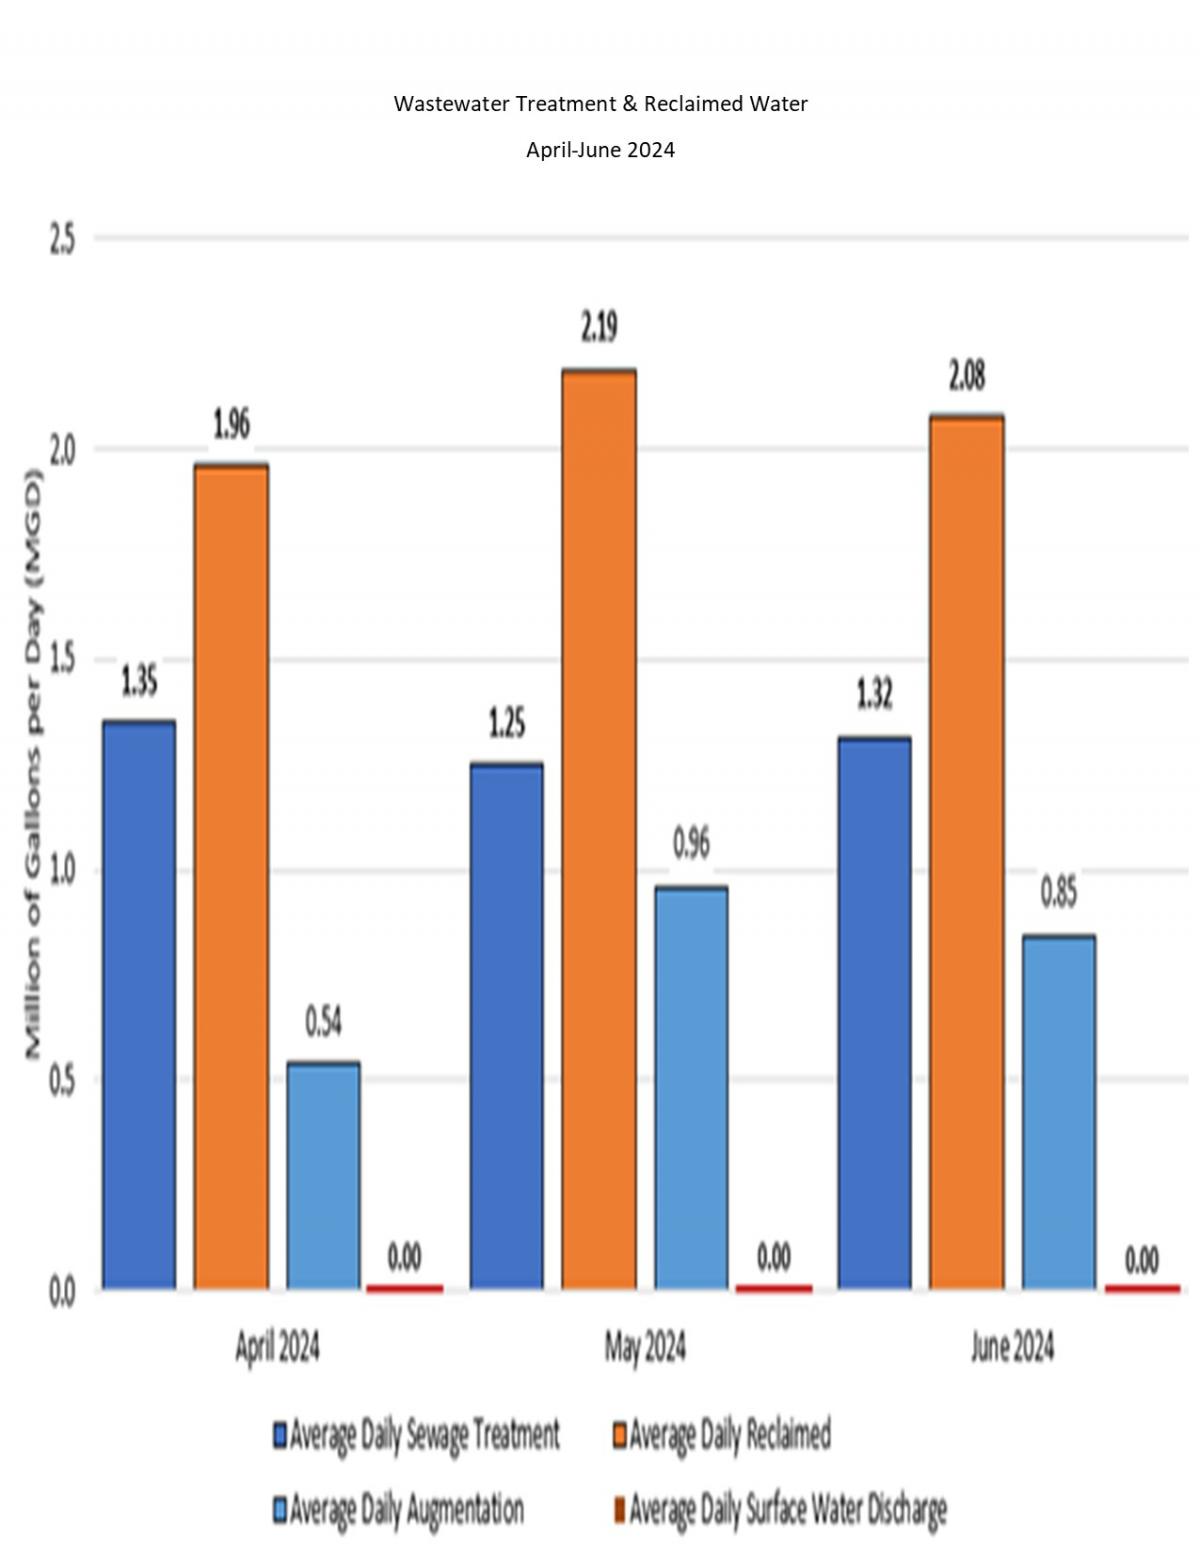
The above graphic shows the daily averages of several KPIs associated with the Wastewater Treatment Division for the Quarter, by month. The division averaged 1.31 million gallons per day of sewage treated, and 2.07 million gallons per day of daily reclaimed processing, including 0.78 million gallons per day of reclaim augmentation. There was no surface water discharge during the quarter. In comparison, the previous Quarter saw a surface water discharge of approximately 0.17 million gallons a day.